Introduction
Ever wondered how the greenhouse system is monitored and controlled, how the food industries store their food and beverages at the correct temperature, and how malls and other public places maintain the indoor temperature? Learn how all of this is made possible by the temperature sensor DHT – how it works, how to program it using in PictoBlox – our graphical programming software based on Scratch blocks – and store and analyze the data on the cloud using Adafruit IO.
Download the PictoBlox from HERE.
Ready. Steady. Go!
What is DHT Sensor?
Let’s begin by understanding what a DHT sensor is!
DHT 11 is a temperature and humidity sensor that uses a capacitive humidity sensor and a thermistor to measure the surrounding air. It provides the data in digital signals i.e. either HI or LOW. 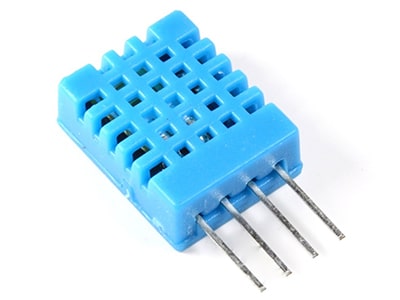
Connecting the DHT Sensor with evive
Now that we know a little about what is a DHT sensor and how it works, let’s connect the DHT sensor with evive- an all-in-one electronics prototyping board.
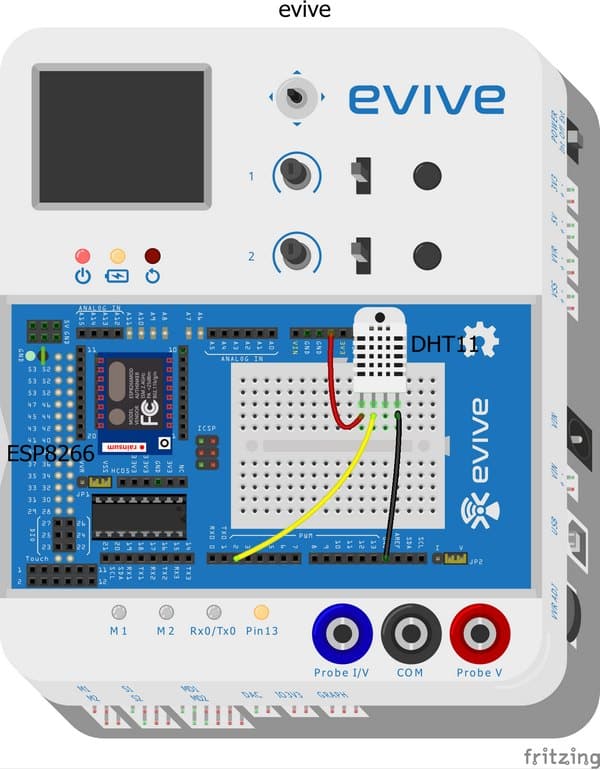
Firstly, connect the DHT sensor to the breadboard on evive.
Next,
- Connect the Leftmost pin to +5V of evive
- Connect the Rightmost pin to the GND of evive
- Connect the second pin of the DHT sensor to Digital Pin 2 of evive.
- Attach the ESP8266 to headers on evive.
Displaying the Temperature Data on evive
Now that we have connected the temperature and humidity sensor with evive, we will display the temperature data on the evive screen. We are going to write our code in PictoBlox to display the data on the screen. Follow the steps below to program.
- Before doing anything else, connect evive to your computer using a USB cable.
- Next, open PictoBlox.
- Then, click the board button and select evive from the drop-down. Now, from the dialogue box that appears, choose the appropriate serial port.
- We will write our code in upload mode, thus click the Stage and Upload Toggle button.
- Next, we are going to use the get () from DHT sensor at pin () block, it reports the temperature and humidity reading from the DHT sensor connected to the selected digital.

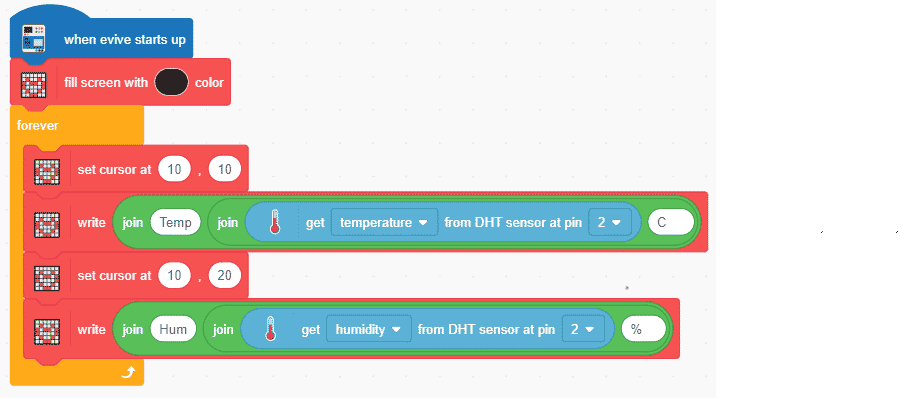
- Fill the screen with black color using the fill screen with () color block.
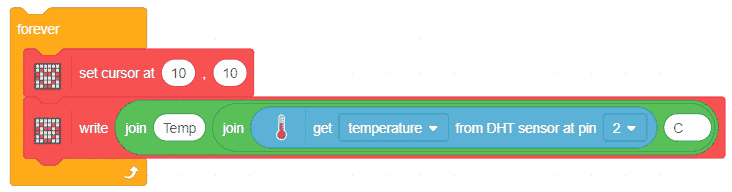
- Now, to get the data from the sensor continuously, use the forever block.
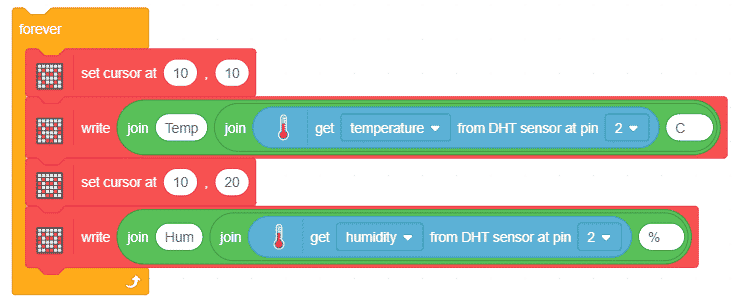
- Now to display the data at a particular point, use the set cursor at () () block and set it at 10, 10.
- Now to write the data on the screen, use the write () block. Add a join block into the white space. Write ‘Temperature’ in the white space and add another join block into the second white space. Drag and drop the get () from the DHT sensor block into the first space and write ‘C’ in the second space as the temperature unit.
- Next, duplicate the above two blocks and place them below. Set the cursor at 10,20. Replace Temperature and Humidity and select humidity from the drop-down of the get () from DHT sensor block.

- Finally, place when evive starts up hat block above the entire script to execute the program.
- Upload the code to evive using the Upload code button. Below is the entire script.
You can download the entire code from here.
Sending and Receiving the Temperature and Humidity data from Adafruit IO
Now, that we have successfully tested and checked that the temperature and humidity sensor DHT is working perfectly fine. Now, we need to send its data to the cloud a.k.a to the Adafruit IO.
- Login to your Adafruit IO account. You can find how to create an Adafruit IO account over here.
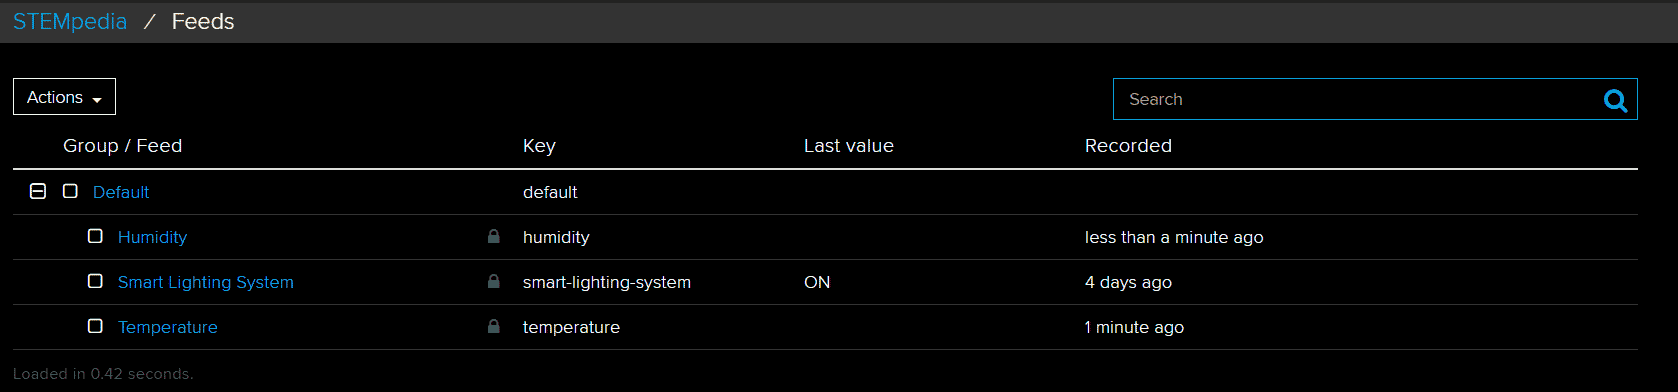
- Now, we need to create two feeds, temperature, and humidity. Click to find out more about feeds here.
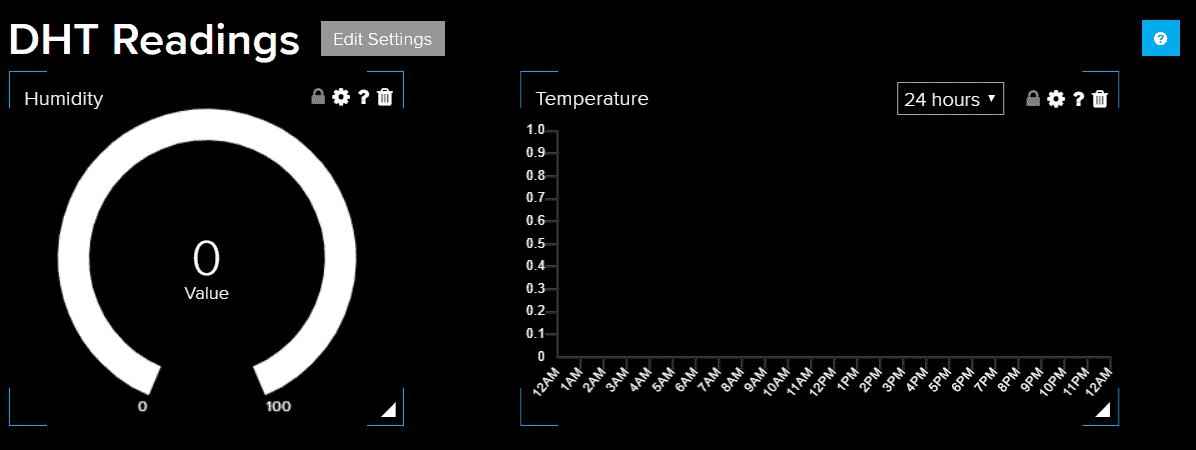
- Next, create a new Dashboard, and name it DHT. Visit the link here to find out more about dashboards.
- Next, we need to add two blocks to our dashboards. Blocks are nothing but widgets.
- A Gauge for Humidity.

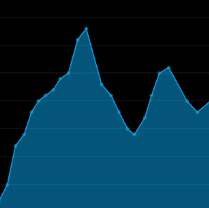
- A Line Graph for Temperature.
- A Gauge for Humidity.
- Into the Line Graph, select the X-axis as Time and Y-axis as Temperature.
- You will find that both the widgets appear below each other, now to make them appear side to side, let’s edit the dashboard.
- Click on the Gear/Settings button.
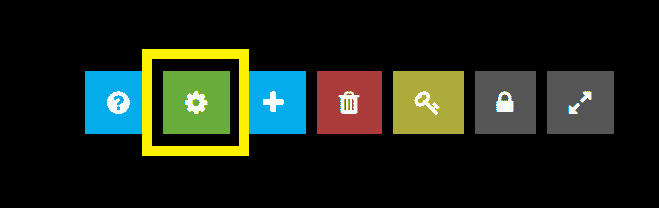
- Now, simply drag and drop the Line Graph next to the Gauge. Next, press Save.
Programming it in PictoBlox
Now that we have set up the dashboard and feeds, it’s time to program it in PictoBlox.
- Open PictoBlox. You can either be in the same program or save the last one and click on New.
- Switch to the Upload Mode.
- Now, before we begin to write the code, we need to add the extension. Add the Internet of Things extension in PictoBlox by clicking the Add extension button in the bottom left corner.
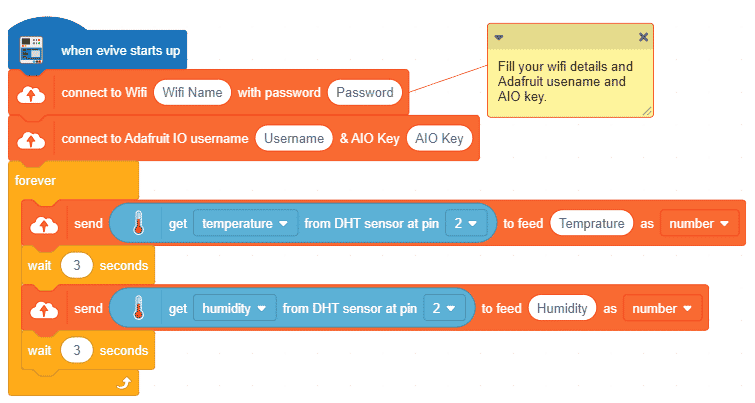
- The block connect to Wi-Fi () with password () and connects the ESP8266 module connected to evive to the Wi-Fi. Enter the Wi-Fi name and password in their respective spaces into the blocks.

- The connect to Adafruit IO username () & AIO key () block connects to the Adafruit Feed using Username and AIO Key. You need to enter the Username and AIO Key in the block. You can get it from your Adafruit dashboard.

- To find the AIO key click on the AIO key button on the Adafruit IO website.
- Find your Active key and copy-paste it to your block in PictoBlox.
- Use the forever block to run the script continuously.
- We will use send () to feed () as () block that takes the data and send the data to the specified feed as a number or a string.

- Drag and drop the send to the feed block. Into the space given, place the get () from the DHT sensor block, and select temperature from its drop-down. As we need to send out data to the Temperature feed, write its name in the space next to the feed and select the type as number.
- Add a delay of 3 seconds.
- Repeat steps 8, and 9 for the Humidity.
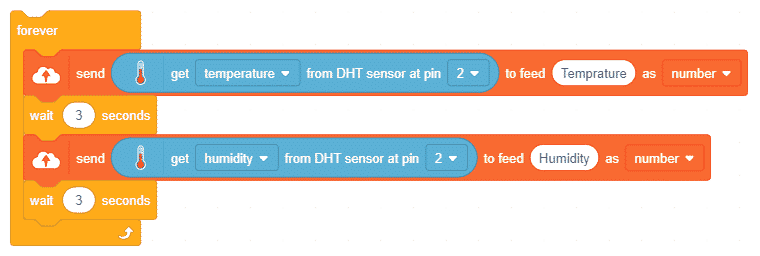
- Finally, add a when evive starts up hat block above the entire script.
You can download the entire code from here. To check whether your device is connected to the Internet and to the Adafruit IO Dashboard visit here.
Now that your evive is connected to the internet you can observe the humidity and temperature on your DHT dashboard.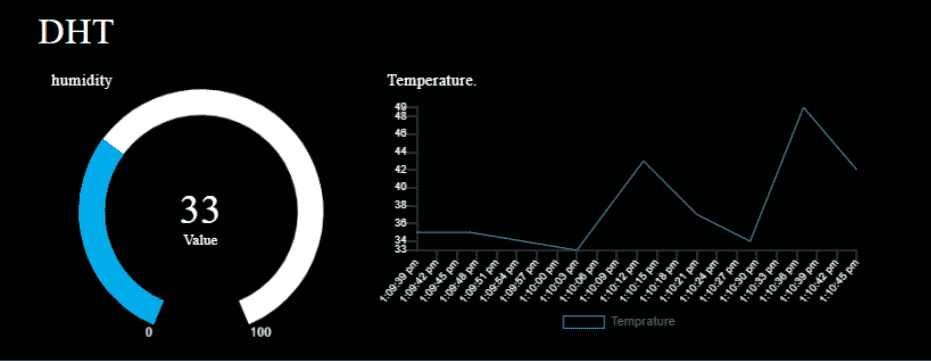
Conclusion
In this lesson, we have learned about the DHT sensor and how it works. We connected it with evive, programmed it using PictoBlox, and then sent the temperature and humidity data to the cloud (Adafruit IO) and visualized the data on a dashboard. We also learned how to use the Internet of Things extension in PictoBlox to connect our evive to the internet.